Transforming user research into an engaging narrative
A collaborative client project that involved designing and printing a book to be distributed internally within the largest industrial manufacturing company in Europe.

Project Overview
Problem
Air pollution in urban areas is a health risk, but current apps fail to present data in a way that encourages awareness or action.
Process
Background research identified a need for more access to engaging air quality data. Ideation followed by low-fidelity prototypes explored different concepts. A responsive website across three breakpoints was developed using HTML, CSS, and JavaScript and an integrated API, with a mobile-first approach. User testing provided feedback to refine the design. A cohesive brand and design system were created to deliver a polished user experience.
Solution
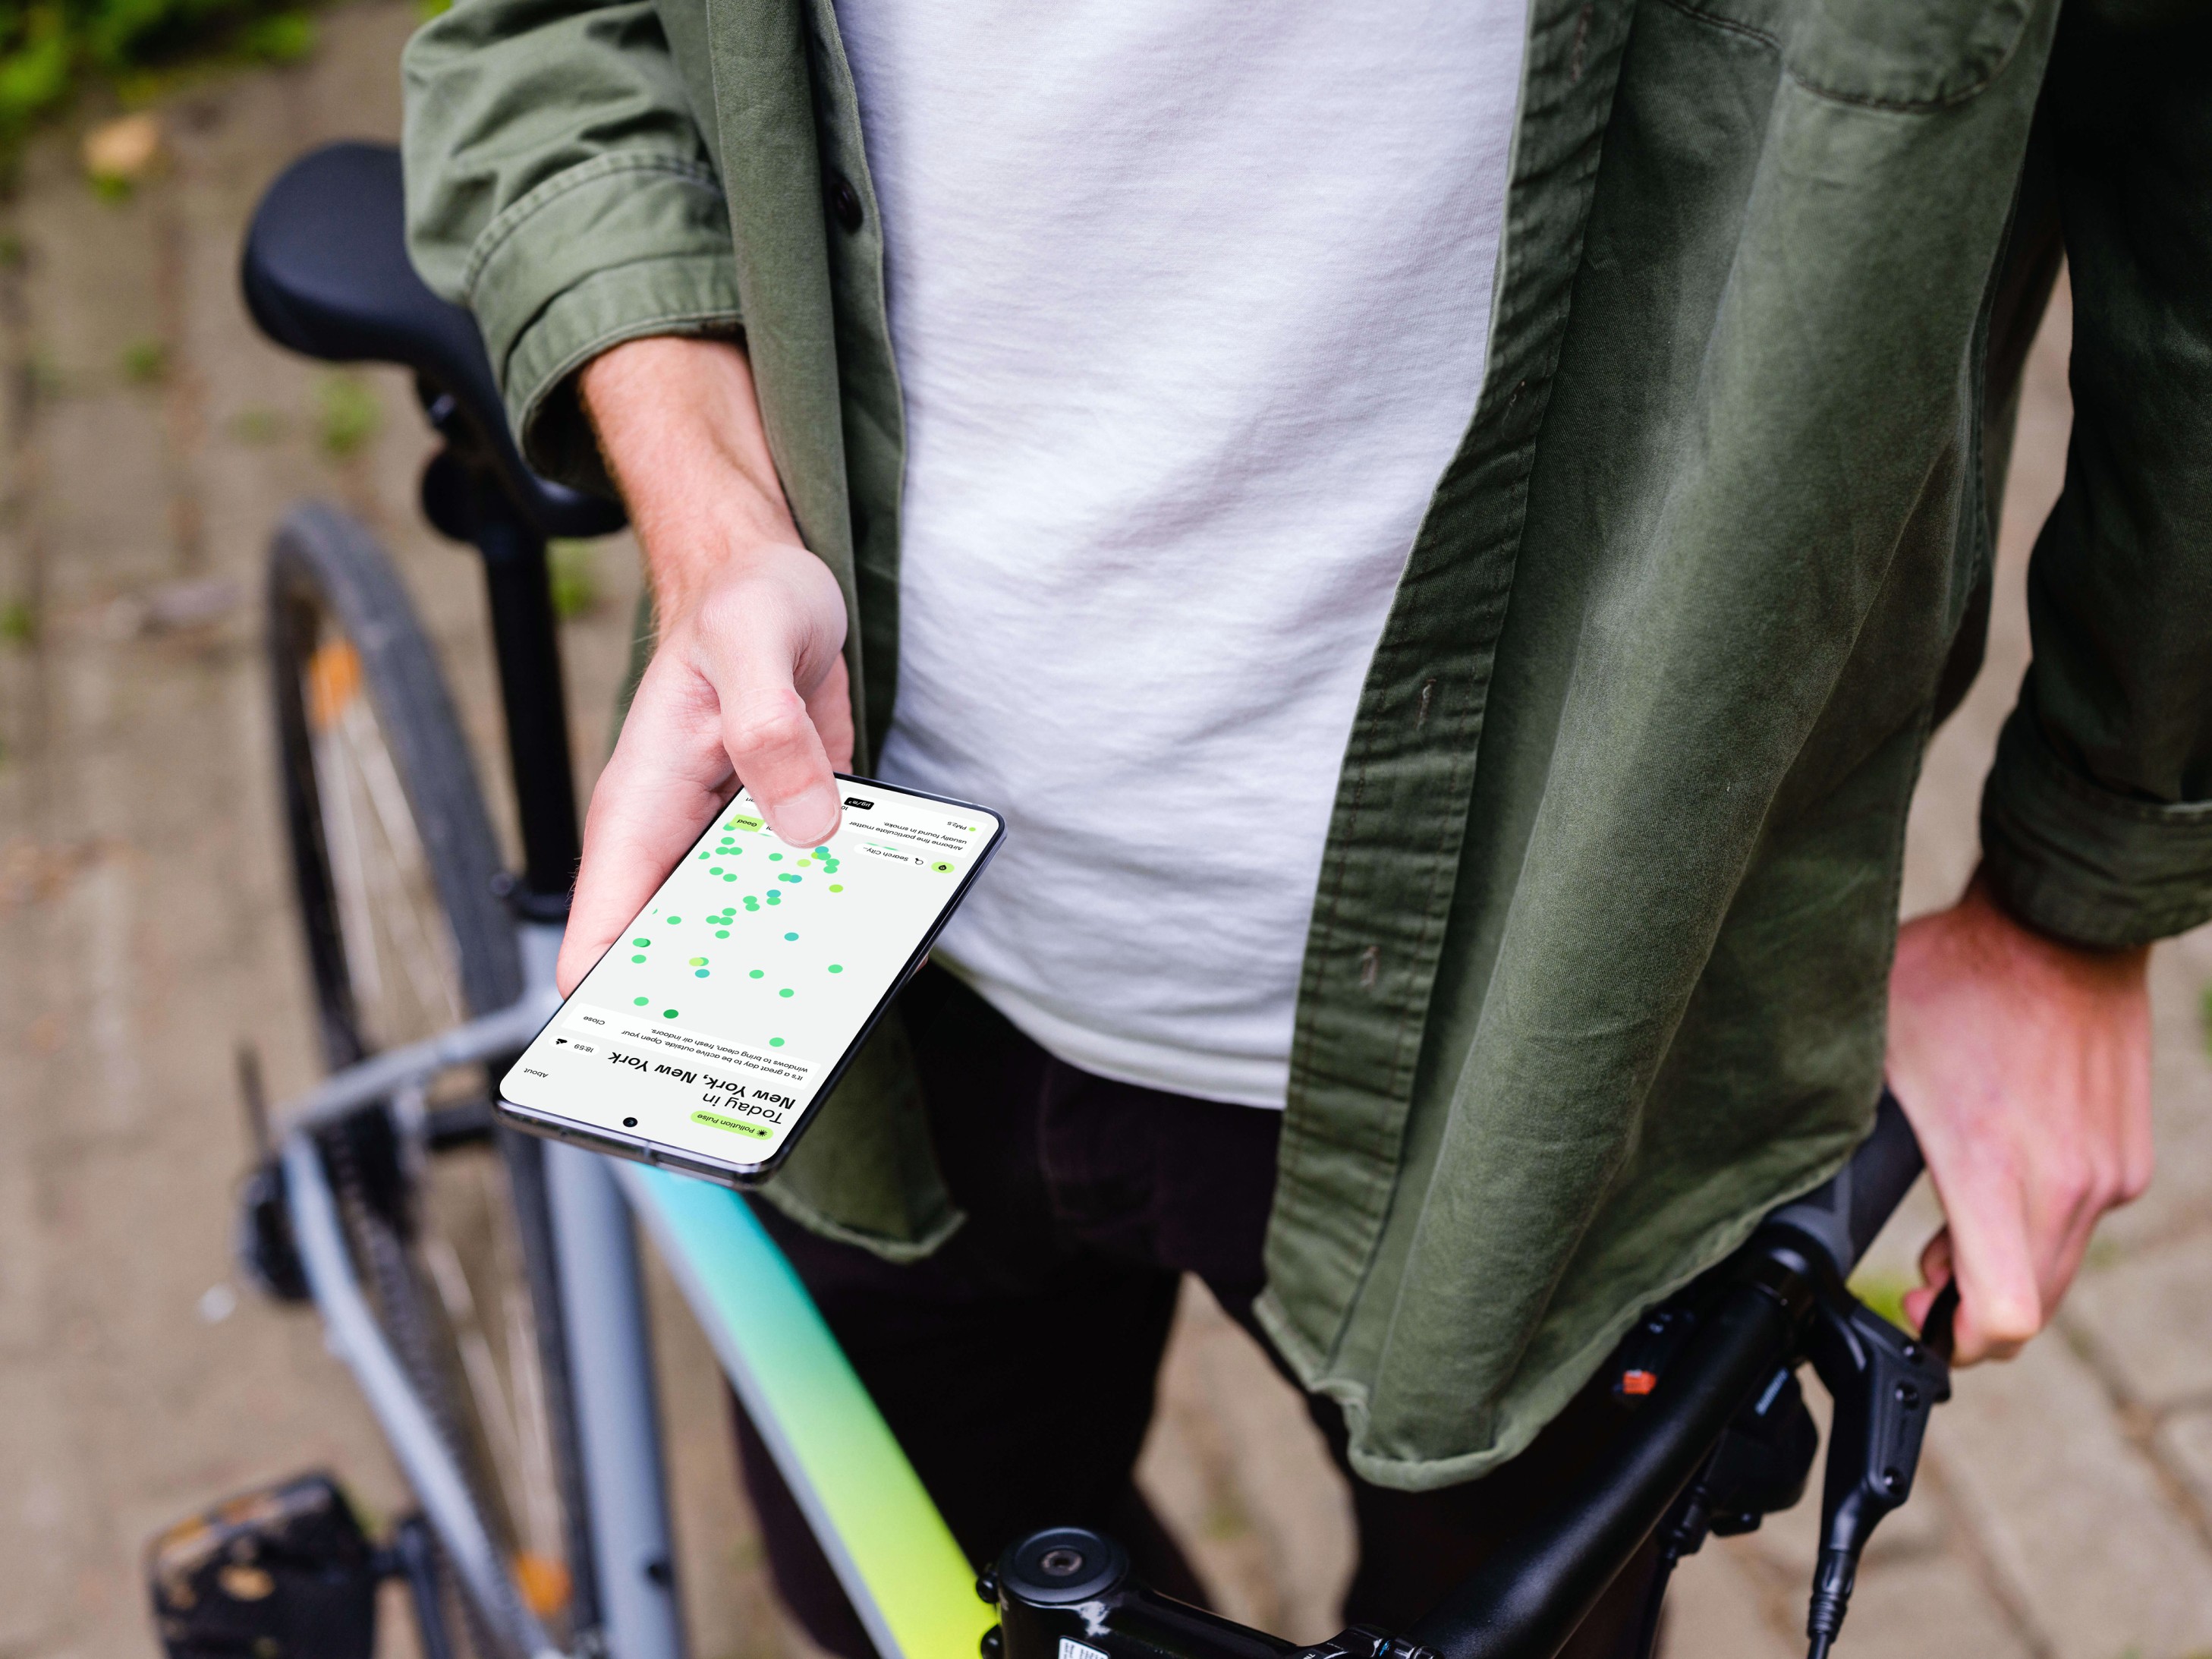
A digital hub for real-time insights into air quality and pollutants in your area, to keep you informed and safe in an engaging way.
Context
Air pollution is a growing concern in urban environments, with millions of people exposed to harmful pollutants daily.
It's advised that sensitive groups, such as people with respiratory conditions or allergies, should have accessible, real-time data to take necessary precautions.
higher risk of acute respiratory symptoms during high pollution days for sensitive groups.
(WHO, 2024)
Background Research
The initial research identified a gap in existing weather apps and websites, such as the iPhone Weather app, where the air quality information isn't easily accessible or visually engaging.
Insights Uncovered
Too Scientific:
Data is overly technical and hard to understand.
Clunky Design:
Poorly designed interfaces make navigation difficult.
Hidden Information:
Air quality data is buried, suggesting it’s less important.
No Engagement:
Minimal educational content or interactive elements.
Weak Visualization:
Data is shown in confusing charts or text-heavy formats.
How might we…?
How might we make air quality data more accessible and actionable for all users, especially those with specific health needs?
Concept Generation
Concept A:
Pollutant circles displayed on different pages. Clicking on a pollutant prompts an overlay with more detail.

Concept B:
All pollutant types move across the screen as circles. Pollutant information remains on the screen at all times.

Solution
Building a Brand Identity


Depending on the AQI the website will dynamically change color to represent the severity of the air condition in the given area.
Relevant lifestyle advice is given based on the condition. Warnings are also provided for sensitive individuals who may need to take extra precautions to safeguard their health.


What could be next for this project?
Search bar optimization with autocomplete and error messages for unknown locations.
Saved/bookmarked locations that the user can quickly return back to.
Further bug fixing!
